Three funding sources
£8.5 billion was spent on Local Transport in 2010-11. The funding English local authorities receive to deliver local transport come from three primary sources (National Audit Office report: Funding for Local Transport, October 2012):
- Department for Transport, comprising:
- Money given directly to councils via block funding for Road Maintenance, Integrated Transport and Highways Maintenance additional funding 2012-2015
- Grants to fund scheme-specific bids, including Local Sustainable Transport Fund, Local Pinch-Point Fund and Better Bus Areas fund
- Ring-fenced payments for specific purposes, such as funding for Tyne and Wear Metro and passenger rail in Merseyside, and specific private finance initiative schemes
- Department for Communities and Local Government Formula Grant (due to be cut by 9%, as reported in December 2013 by Public Finance News)
- Local Authority own funds, typically made up from:
- Council Tax
- Business rates
- Parking fees and charges
- Borrowing
1. From the Department for Transport
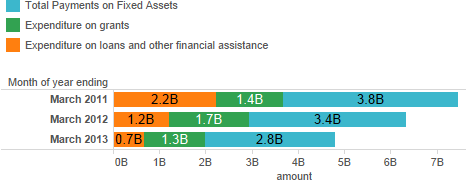
Using data from the Capital Outturn Return datasets, we can see just how much money was spent in each of these categories in 2010-11, 2011-12 and 2012-13. I believe the categories above relate to those in the COR1 dataset as follows:
- Block funding = Total Payments on Fixed Assets
- Grants for scheme-specific bids = Expenditure on Grants
- Ring-fenced payments = Expenditure on Loans and other financial assistance
There are two versions of this visualisation, the first representing All England spend, and the second excluding the spend in London. There is quite a difference! London receives about half of the total Department for Transport funding for local transport.
First let’s take a look at the data for all of England:
And now excluding the data for London:

Pingback: Introducing West Midlands Open Data Forum | wmodf